Help
About FunCoup
The name FunCoup [fən kəp] stands for functional coupling. FunCoup is a framework to infer genome-wide functional couplings in 22 model organisms. Functional coupling, or functional association, is an unspecific form of association that encompasses direct physical interaction but also more general types of direct or indirect interaction like regulatory interaction or participation in the same process or pathway.
Framework
Briefly, the FunCoup framework integrates 10 different evidence types derived from high-throughput genomics and proteomics data in a naive Bayesian integration procedure. The evidence types are discussed in more detail below. Evidence is transferred across species using orthology assignments from InParanoiDB 9.
The naive Bayesian integration combines the likelihood for coupling and no coupling in the form of log-likelihood ratios (LLRs) for all data sets. LLRs for data of the same type are corrected to account for cross-data redundancies. The sum of LLRs for a gene pair is called the final Bayesian score (FBS) and expresses the amount of support the data shows for a coupling. To simplify the interpretation the FBS is transformed into a precision score (PPV) that ranges from 0.5 to 1. For more details, please have a look at the FunCoup publications.
Networks
FunCoup differentiates between six different classes of functional couplings: complex co-membership (Complex), co-membership in a metabolic pathway (Metabolic), shared operon (Operon), protein-protein interaction (PPI), gene regulation (Regulatory), and co-membership in a signaling pathway (Signaling). For each class a separate network is created. Additionally a composite or summary network is created by taking the strongest coupling from the different classes for each pair.
Tutorials
A playlist of video tutorials with an introduction and demos on FunCoup can be found on YouTube.
Additional resources, e.g. slides and an R-notebook on offline usage, can be found in Google Drive.
Evidence Types
Evidences are the signals that support or contradict the presence of functional coupling. Typically some kind of scoring function is used to convert raw data into evidence. For a complete list of all data see here. FunCoup integrates 10 different evidence types listed below.
Domain interactions (DOM)
Domain-domain interaction (DOM) uses pre-computed scores from UniDomInt (v1.0), which reflect support from various databases. Domain interactions are mapped to protein pairs using Pfam (v35.0). DOM is calculated as the ratio of scored domain pairs (m) to all possible pairs (N), multiplied by the average score and weighted by the log of the sum of the interacting domains' degrees. N is the product of Pfam domains in A and B.
Genetic interaction profile similarity (GIN)
Genetic Interaction (GIN) is measured using Spearman correlation of genetic interaction profiles, based on BioGRID (v4.4.219). A gene's interaction profile shows how it interacts with other genes, and similar profiles between two genes suggest they may be functionally related.
Gene Regulation (GRG)
Gene Regulation (GRG) data was extracted from ENCODE (v131.0) using BED narrowPeak files for human, mouse, worm, and fruit fly. We used enrichment scores from IDR-thresholded peaks processed by standard ENCODE or Robert-Waterston pipelines. After normalizing datasets to account for variability, they were intersected, and redundant interactions were ranked by enrichment score. We used genomes GRCh38 and mm10 from ENCODE, and ce11 and dm6 from Ensembl, to annotate genes.
mRNA co-expression (MEX)
mRNA co-Expression (MEX) was calculated using Spearman correlation of expression profiles from healthy samples, based on data from GEO and Expression Atlas. Only pairs with absolute correlation above 0.5 were retained and normalized. Homolog pairs were excluded, identified in FunCoup 6 using DIAMOND with an E-value below 0.001.
Co-miRNA regulation by shared miRNA targeting (MIR)
MicroRNA Regulation (MIR) was calculated using the Jaccard index for microRNAs regulating each protein pair, with only positive values retained.
Protein co-expression (PEX)
Protein co-Expression (PEX) was measured using PaxDB (v5.0) mass spectrometry data in two ways: by correlating expression profiles across tissues and by calculating the Jaccard index for the top 25% of tissues where each protein pair is expressed.
Phylogenetic profile similarity (PHP)
Phylogenetic Profile Similarity (PHP) was evaluated using data from 640 species in InParanoiDB 9. A distance matrix and orthophylogram were built using orthologs from these species. Each protein in FunCoup species received a profile where the presence or absence of an ortholog was marked as 1 or 0. PHP scores were calculated using a neighbor-joining tree rooted at the species of interest. The score is based on the logarithmic ratio between a 'positive score' (branch length of species with orthologs for both proteins) and a 'negative score' (branch length of species with an ortholog for only one protein), with deeper conservation indicating stronger functional association.
Physical Interaction (PIN)
Physical Interaction (PIN) was calculated as the weighted average of the number of publications listed in iRefIndex (v2022-08), with weights based on the logarithm of findings in each publication, adjusted by the log sum of the degree of connections. The degree of connections represents the total number of interactions protein A has in IrefIndex, helping to increase specificity by accounting for proteins with many interactions.
Sub-cellular co-localization (SCL)
SubCellular Localization (SCL) was measured by calculating the semantic similarity of Gene Ontology (GO) keywords (v2023-03). Similarity scores were computed using the Wang et al. graph-based method, which leverages the topology of GO's Directed Acyclic Graph structures.
Transcription Factor Binding profile similarity (TFB)
Transcription Factor Binding profile (TFB) was measured using the Jaccard index for transcription factors binding to each protein pair, with only positive values retained. Data was sourced from TFLink (v1.0).
Gold Standards
Complex
Gold standard couplings for protein complexes were collected from iRefIndex (v2022-08), ComplexPortal (v2023-06) and Corum (v2022-11). The protein complexes from iRefIndex were filtered to exclude very large complexes including large parts of the proteome.
Metabolic
Metabolic gold standard links were created as fully connected networks between proteins that are part of KEGG (v101.0) metabolic pathways.
Operon
Shared operons gold standard links were collected from OperonDB (v2022-02). The operon gold standard is available for E. coli, C. elegans and B. subtilis.
PPI
Protein-protein interaction (PPI) gold standard links were taken from iRefIndex (v2022-08) and must be supported by at least two experiments or included in another gold standard. To reduce noise, we focused on physical interactions, limiting each experiment to a maximum of 100 interactions.
Regulatory
Regulatory gold standard links were added using data from TRRUST (v2.0), RegNetwork (v2019-04), RegulonDB (v2022-12), and Yeastract (v2022) for S. cerevisiae to capture transcription factor interactions for H. sapiens, M. musculus, E.coli, and S. cerevisiae. For human and mouse links, we used the union of TRRUST and RegNetwork.
Signaling
Signaling gold standard links were created as fully connected networks between proteins that are part of KEGG (v101.0) signaling pathways.
Search Options
Normal search
The default query retrieves the most strongly connected genes to one or multiple genes from the selected species network. The query searches for exact matches of symbols or identifiers and supports a variety of different identifier types including Ensembl gene, protein, and transcript IDs, NCBI gene IDs, RefSeq IDs and UniProt IDs. For a search with multiple genes the identifiers should be separated by spaces. To get more control and alternative query options expand the advanced search options.

SARS_CoV-2 search
To simplify searching in the virus-host network for SARS-CoV-2 and Homo sapiens, we have introduced a specific button just for this purpose. The button can be found beneath the regular search-button, and clicking it will pre-fill a query with the SARS-CoV-2 genes, a confidence cutoff of 0.3, 50 nodes per expansion step, and then perform the search.

Orthology-transferred species search
In FunCoup 6, networks for all 640 species in InParanoiDB 9 are generated by transferring links from the closest species in the 22 primary FunCoup networks, using orthologs from InParanoid. NCBI taxonomy lineage information, or the shortest distance in an orthophylogram for InParanoiDB, was used to find the closest FunCoup species. Queries for the 618 transferred species can only be performed using UniProt IDs.
Advanced search
There are 3 different categories of advanced search options. The first category "Sub-networks" controls how the subnetwork around the query is retrieved. The sub-network retrieval starts from the query genes and adds the top most strongly connected genes which have at least one connection to the query that is stronger than the given link confidence threshold, finally all links between the retrieved gene set that are stronger than the threshold are added. Four parameters can be adjusted for this expansion: the link confidence threshold, the direction confidence threshold, the number of most strongly connected genes that should be added, and how many expansion steps should be performed. If more than one expansion step (the default) is used, genes that were retrieved in the previous iteration are used as a query set in the next iteration and the process is repeated. If 0 expansion steps are selected only links between the query genes are retrieved and no genes are added.
There are 4 different algorithms to expand the network that differ in how multiple query genes are handled. The simplest algorithm "Genes as group" retrieves the N strongest interactors to any of the query genes. If the option "prioritize common neighbors" is activated, all links to all query genes are considered and genes that are most strongly linked to many query genes are prioritized. Otherwise only the strongest link to a query gene counts.

The option "Each gene independently" is used to treat the query genes as independent and retrieve the N interactors for every query gene.

MaxLink search
The MaxLink search provides an alternative to the standard search. MaxLink has been successfully applied to predict novel cancer genes and was first described in Network-based Identification of Novel Cancer Genes (Östlund et al. 2010). It is meant to be used with a long list of related query genes and retrieves genes that are signifcantly stronger connected to the query than expected by chance. Four parameters can be adjusted for this expansion: the link confidence threshold, the direction confidence threshold, the cutoff used for the hypergeometric test of the candidate proteins (0.05 by default), and the number of retrieved candidates proteins.

TOPAS search
The TOPAS search is designed for detecting modules within networks. It is meant to be used with a long list of related query genes and has proven effective in identifying biologically relevant disease modules, as described in TOPAS, a network-based approach to detect disease modules in a top-down fashion (Buzzao et al. 2022). Three parameters can be adjusted for this expansion: the link confidence threshold, the direction confidence threshold, and the number of potential connector(s) in a shortest path between any two of seeds.

The Comparative Intactomics search
The next advanced search option tab allows you to run a comparative query across the networks of multiple species. This query retrieves the orthologs to the query genes and the sub-networks around them that maximizes the number of conserved links. If the toggle "Use species-specific evidence only" is checked, the search requires sufficient species-specific evidence (lowering the link confidence cutoff is recommended in this case). If this option is not checked orthology transfer might led to spurious sub-networks conservation. When the "Align orthologs only" is checked, only query network orthologs are fetched, otherwise each species network is independently queried using orthologs from the original query.

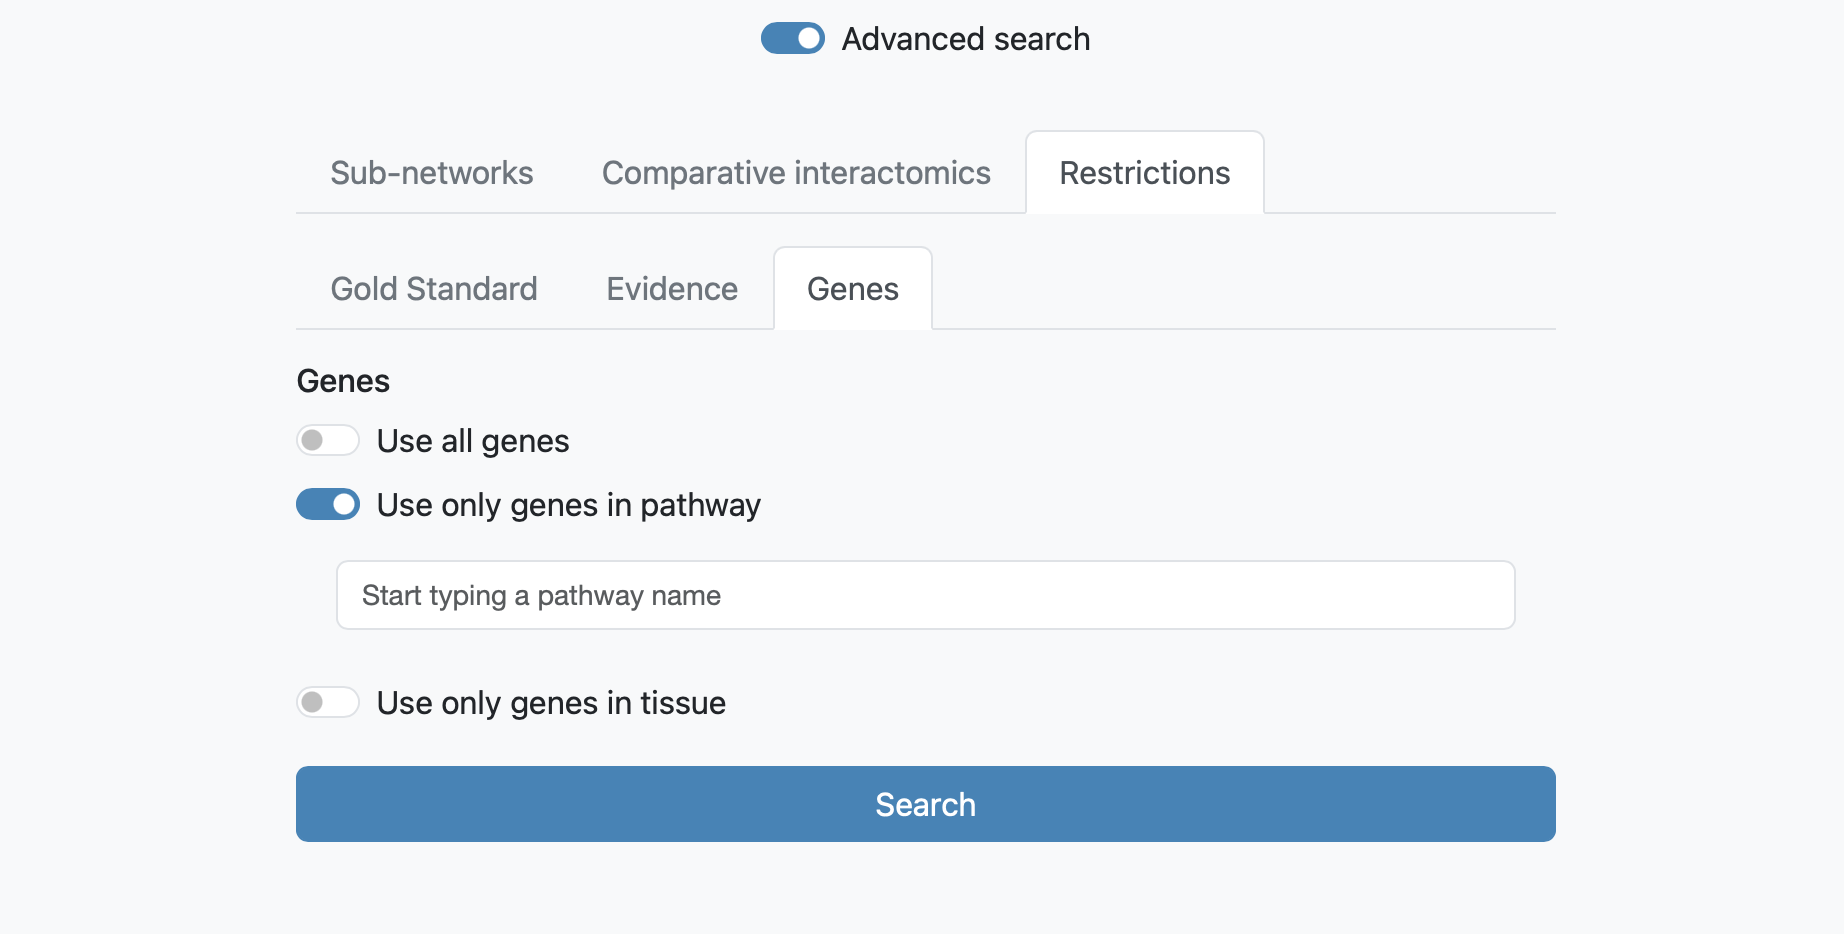
Search with restrictions
The next tab allows to restrict the search to one specific functional coupling class, at 3 different levels: Gold Standard, Evidence or Genes.
Restrictions at Gold Standard level allows to visualize subnetworks as the result of the combination of all Gold Standards (by default),
or of one Gold Standard at a time.

Restrictions at Evidence level allows to visualize subnetworks as the result of the combination of all Evidences from all species (by default),
or choose the combination of evidence and species that you prefer. In this case, the confidence values are recomputed (lowering the link confidence cutoff is recommended).

Restrictions at Genes allows to visualize subnetworks as the result of the combination of all genes (by default), or of the genes with one selectable pathway or tissue annotation.
It is possible to combine search options from different tabs whenever this is sensible.
To resolve ambiguities in gene names, we perform a database search to identify any unmatched or ambiguous genes. Users can then review and select the correct genes on an intermediate page.

Results Views
Network
The network view displays the retrieved sub-network as a graph. By default the viewer shows a summary network with the links from the strongest coupling class for each gene pair.

The menu box on the left is grouped in four sections; Network Information, Filter Network, Network appearance and Download. The Network information section displays the name of the species included in your search, as well as the color of that species nodes. It also displyas the total number of genes and links within the shown subnetwork.

Customization
The sections Filter Network and Network appearance have various options to manipulate the network. The Filter Network section may contain up to two options, Filter by Tissue and Filter by Pathway, when annotations are available. By typing in the name of a tissue in the Filter by Tissue search box, you can select one or multiple tissues to filter the subnetworks. By default, no tissue is selected. By typing in the name of a pathway in the Filter by Pathway search box, the viewer highlights participating nodes in the species color, and the nodes not included in the pathway turns gray.

The Network appearance section is divided in Nodes and Links. In the Nodes subsection, the user can color all nodes at once, color by Tissue or Pathway, as well as vary node Label and node Size. Label: the default node label refers to the query identifier, but can be set to UniProt, Ensembl or NCBI ID. Additionally the label can also display species name, node degree or, if set to none, hide all the labels. Size: Node sizes scale with node degrees to emphasize gene importance. This can be adapted to scale depending on the number of participating pathways or not scale at all if set to none. In the Links subsection, the user can color all links at once, manipulate the node Charge, and the link Distance. If at least one link in the subnetwork has a direction, the Show directions checkbox will be selected by default. Uncheck the checkbox to hide the directions for the links. Charge: This slider alters the tension between the nodes.

Interactions
The interactions view lists all interactions between subnetwork genes and shows details about how the links that have been derived. The query genes are highlighted in bold. The green and red boxes represent positive and negative LLR for the different evidence types and species, hovering with the cursor over the box will display the LLR. Known coupled pairs in gold standards are highlighted with a golden box. Initially only the strongest coupling class for each pair is shown. Clicking anywhere on a row of the Interactions table will expand all other coupling classes for a pair.
 By hovering anywhere on a row of the Interactions table, will highlight the link in the subnetwork viewer.

Clicking on the Details button will fade the main view and open up a side window displaying all evidence that led to the prediction. The evidence is sorted by decreasing LLR, and is first summarized into a bar chart, then listed with cross links to data sources. The last two columns show the type of the evidence and the species from which the evidence originates.

Interactors
The interactors view gives an overview of all subnetwork genes. Query genes and other subnetwork genes are displayed in separete boxes. For each gene the Gene Symbol, UniProt, Ensembl and NCBI IDs are shown. A dropdown-toggle button to the left of the gene name will allow you to use the gene as a query or to add it to the current query. Following is a short description of the gene, and a box to color the node in the network. By hovering anywhere on a row of the Interactors table, will highlight the node in the subnetwork viewer. If the results of a MaxLink search are visualized, the number of links to the query (MaxLink score) and the significance of the hit are shown in separate columns.

Pathway Enrichment Analysis
Pathway enrichment analysis helps identify key biological processes impacted by gene sets. Our website offers three top-performing algorithms EASE, ANUBIX, and BinoX, selected from our latest benchmark paper Benchmarking enrichment analysis methods with the disease pathway network (Buzzao et al. 2024), to analyze gene overlap and network crosstalk with KEGG pathways using FunCoup subnetworks. A button is available to redirect searches to PathBIX for further exploration.

Download
The "Download" view allows you to download the query subnetwork either in tab-separated values (TSV) file or portable network graphic (PNG). TSV is a de facto standard for network data and can amongst other things be imported into Cytoscape. The different columns are: the proteinA,proteinB pair names, the Gold Standard network of origin, the PPV confidence score, the FBS max score, a binary [0,1] to identify if the pair is a Gold Standard link, and the direction if any. The links in the network file correspond to the strongest coupling class. For a comparative query the networks for the different species are given in separate TSV files. If pathways or tissues are applied as filters or colors, they are also included as annotations.
Modify search
The modify search view brings back the current search and allows you to change the keywords or to review and modify the parameters.
FAQ
How do I cite FunCoup?
Please cite the latest paper from here if you are using the database or if you want to refer to the FunCoup algorithm. If you are using MaxLink please also cite Network-based Identification of Novel Cancer Genes (Östlund 2010).
How do I get only the couplings between my query genes
By default the FunCoup search returns the subnetwork of your query and the strongest coupled genes to your query. If you are only interested in links between your query genes, go into the advanced search options and set the "Expansion depth" on the "Sub-network selection" tab to 0.
Where can I get help?
See here
I know gene X and gene Y are coupled, why is there no link between them in FunCoup?
Have you tried lowering the confidence threshold?
It should be noted that the main objective of FunCoup is the prediction of
Why is there no network for species X?
Creating a functional coupling network for a species requires a lot of data including high-quality known couplings. The process involves a lot of manual work and is computationally demanding, we therfore focus on a small number of well studied model organisms.
Is the previous version of FunCoup still accessible?
Yes, all previous versions of the networks can be downloaded from the "Archive" page.
Citation
Buzzao, D., Persson, E., Guala, D., Sonnhammer, E, L. (2024)
FunCoup 6: advancing functional association networks across species with directed links and improved user experience.
Nucleic Acids Research, 50 (Database issue)
Persson, E., Castresana-Aguirre, M., Buzzao, D., Guala, D., Sonnhammer, E, L. (2021)
FunCoup 5: Functional Association Networks in All Domains of Life, Supporting Directed Links and Tissue-Specificity.
Journal of molecular biology, 433, 166835.
Ogris, C., Guala, D., Kaduk, M., Sonnhammer, E. L. (2017)
FunCoup 4: new species, data, and visualization.
Nucleic Acids Research 46 (Database issue), D601-D607.
Schmitt, T., Ogris, C., & Sonnhammer, E. L. (2013).
FunCoup 3.0: database of genome-wide functional coupling networks.
Nucleic Acids Research, 42 (Database issue), D380-8
Alexeyenko, A., Schmitt, T., Tjärnberg, A., Guala, D., Frings, O., & Sonnhammer, E. L. (2012).
Comparative interactomics with Funcoup 2.0.
Nucleic Acids Research, 40 (Database issue), D821-8
Alexeyenko, A., & Sonnhammer, E. L. (2009).
Global networks of functional coupling in eukaryotes from comprehensive data integration.
Genome Research, 19(6), 1107-1116
License

This work is licensed under a Creative Commons Attribution-ShareAlike 4.0 International License.